
in order to apply mathematical modeling to solve real-world applications.
The next growth we will examine is exponential growth. Linear growth occurs by adding the same amount in each unit of time. Exponential growth happens when an initial population increases by the same percentage or factor over equal time increments or generations. This is known as relative growth and is usually expressed as a percentage. For example, let’s say a population is growing by 5% each year. This means that 5% of the current population is added each year to the total. If the population was originally 10,000 in the first year, then 5% of 10,000 would be added which is 500, giving a new population of 10,500. In the second year, another 5% would be added, but this time you would take 5% of 10,500 which is 525, giving a new population of 11,025. While the percentage growth is the same each year, the actual number of people added changes, which makes this growth different from the linear model discussed earlier!
A quantity grows exponentially if it grows by a constant factor or rate for each unit of time.
In this graph, the blue straight line represents linear growth and the red curved line represents exponential growth.
A city is growing at a rate of 1.6% per year. The initial population in 2010 is \(P_ = 125,000\). Calculate the city’s population over the next few years.
Solution
The relative growth rate is 1.6%. This means an additional 1.6% is added on to 100% of the population that already exists each year. This is a growth factor of 101.6%.
We can create an equation for the city’s growth. Each year the population is 101.6% more than the previous year.
\[P(t) = 125,000(1+0.016)^ \nonumber\]
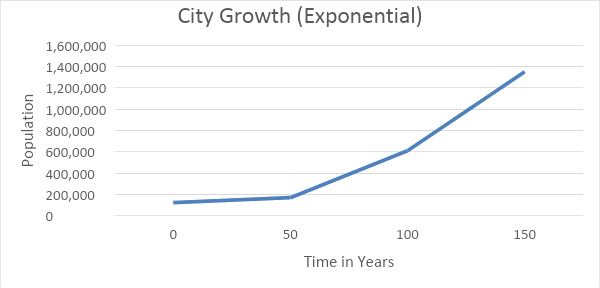
Note: The graph of the city growth follows an exponential growth model
St. Louis, Missouri has declined in population at a rate of 1.6 % per year over the last 60 years. The population in 1950 was 857,000. Find the population in 2014. (Wikipedia, n.d.)
Solution
The relative rate of decrease (known as a decay rate) is 1.6%. This means 1.6% of the population is subtracted from 100% of the population that already exists each year. This is a factor of 98.4%.
We can create an equation for the city’s growth. Each year the population is 1.6% less than the previous year.
So the population of St. Louis Missouri in 2014, when \(t = 64\), is:
Note: The graph of the population of St. Louis, Missouri over time follows a declining exponential growth model.
The average inflation rate of the U.S. dollar over the last five years is 1.7% per year. If a new car cost $18,000 five years ago, how much would it cost today? (U.S. Inflation Calculator, n.d.)
Solution
To solve this problem, we use the exponential growth model with r = 1.7%.
This car would cost \($19,582.91\) today.
In May of 2014 there were 15 cases of Ebola in Sierra Leone. By August, there were 850 cases. If the virus is spreading at the same rate (exponential growth), how many cases will there be in February of 2015? (McKenna, 2014)
Solution
To solve this problem, we have to find three things; the growth rate per month, the exponential growth model, and the number of cases of Ebola in February 2015. First calculate the growth rate per month. To do this, use the initial population\(P_ = 15\), in May 2014. Also, in August, three months later, the number of cases was 850 so,\(P(3) = 850\).
Use these values and the exponential growth model to solve for \(r\).
The growth rate is 284% per month. Thus, the exponential growth model is:
Now, we use this to calculate the number of cases of Ebola in Sierra Leone in February 2015, which is 9 months after the initial outbreak so, \(t=9\)
If this same exponential growth rate continues, the number of Ebola cases in Sierra Leone in February 2015 would be 2,725,250.
This is a bleak prediction for the community of Sierra Leone. Fortunately, the growth rate of this deadly virus should be reduced by the world community and World Health Organization by providing the needed means to fight the initial spread.
Note: The graph of the number of possible Ebola cases in Sierra Leone over time follows an increasing exponential growth model.
According to a new forecast, the population of Puerto Rico is in decline. If the population in 2010 is 3,978,000 and the prediction for the population in 2050 is 3,697,000, find the annual percent decrease rate. (Bloomberg Businessweek, n.d.)
Solution
To solve this problem we use the exponential growth model. We need to solve for r.
\[\beginP(t) &= P_(1+r)^ \text t = 40 \text< years>\\[4pt] P(40) &= 3,697,000 \text P_ = 3,978,000 \\[4pt] 3,697,000 &= 3,978,000(1+r)^ \\[4pt] 0.92936 &= (1+r)^ \\[4pt] \sqrt[40] &= \sqrt[40]<(1+r)^> \\[4pt] 0.99817 &= 1+r \\[4pt] -0.0018 &= r \end\]
The annual percent decrease is 0.18%.
Let’s say that on April 1st I say I will give you a penny, on April 2nd two pennies, four pennies on April 3rd, and that I will double the amount each day until the end of the month. How much money would I have agreed to give you on April 30? With \(P_ = $0.01\), we get the following table: